





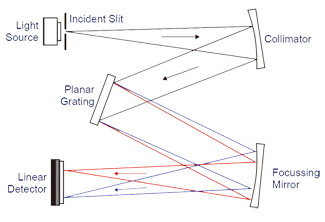
 It is easy to assume that all Czerny-Turner optical cavity spectrometers are the same - after all, it's just a combination of slit, collimating mirror, grating, focussing mirror and sensor. Maybe there's a 2nd order graduated filter on the sensor, and possibly a cylindrical lens to increase sensitivity but "aren't they all the same".
The short answer is "definitely not", the longer answer is that the choice of substrate material for those optical elements all have an effect, as does the quality and performance of the optical coatings. The optical bench needs to be rigid, but also matched in terms of thermal coefficient of expansion, and the design and light-absorbing coating of stray light traps also impact performance. Finally, the choice of adhesives, control of the location and quantity dispensed, and the cure process, all play a part.
Producing the spectrometer under cleanroom conditions should be standard procedure, but shouldn't be assumed, and OtO Photonics are possibly the only manufacture who implements a 7-day "set aside" during the production process to allow for stress relief and associated micro-movement of components before calibration and final test - resulting in the smallest "pixel shift" in the industry.
It is difficult to make comparisons between models from different manufacturers, but here we discuss testing of the SmartEngine SE2020 and compare it with the Ocean Optics USB2000+. These models both use the same linear sensor, Sony's ILX511B, and have the same spectral range. Therefore, differences in performance can be assigned to the characteristics of the optical cavity, so apply to the entire SmartEngine family.
The only difference is that the SE2020 features a 50µm slit width whereas the USB2000+ is 25µm. These configurations were selected as the data sheet specification for FWHM optical resolution are similar, <1.9nm for the SE2020 and 1.5nm for the USB2000+.
The summary of the optical characteristics, which were produced by an OtO customer, using standard commercial off-the-shelf models purchased from both manufacturers, is below:-
| Parameter | SE2020 (50µm slit) | USB2000+ (25µm slit) | ||
| Specification | Measured | Specification | Measured | |
| FWHM Resolution (nm) | 1.9 | 1.62 | 1.5 | 1.68 |
| Wavelength Accuracy (nm) | 0.4 | -0.09 | 0.4 | -2.05 |
| Sensitivity (Visible Range) | ~ | Normalised @ 1 | ~ | 0.53 |
| Stray Light (435-450nm) |
<0.15% @ 450nm |
0.13% | <0.1% @ 435nm |
0.16% |
| SNR | 250 | 250 | 250 | 250 |
| Linearity | 99% | 99.5% | 99% | 93% |
| Residual Error | 1% | 0.5% | 1% | 7% |
Key points evident from the table are:-
- The SE2020 meets, or exceeds, the published specification.
- The SE2020 achieves superior performance in all parameters.
- Higher sensitivity of the SE2020 is expected given the wider slit width
- The superior resolution of the SE2020, despite the wider slit, demonstrates superior optical performance.
Further testing was then carried out to test the performance of the two spectrometers under temperature and humidity cycling. Over a period of 24 hours, temperature was repeatedly cycled from -10°C to +50°C and relative humidity from 50% to 100%. Measurements were taken at 10 wavelengths from 365.015nm to 826.452nm and the worst-case figures for both models are summarised below:-
| Parameter | SE2020 | USB2000+ |
| Measured | Measured | |
| Wavelength Drift vs. Temperature (nm) | ≤0.9 | ≤2.3 |
| FWHM Resolution vs. Temperature (nm) | ≤2.4 | ≤6.1 |
| Wavelength Drift vs. Humidity (nm) | -0.05 to -0.4 | -0.4 to -1.2 |
| FWHM Resolution vs. Humidity (nm) | 1.7 | 2 |
Finally, OtO carried out shock and vibration testing for the SE2020. Testing was not carried out on the USB2000+ so we cannot offer a comparison, but that does not invalidate the performance of the SE2020, videos of the testing are available below:
| Shock Testing: 50G, 6 times | Vibration Testing: 1.5g X-, Y- & Z-axis, 30 minutes |
| Parameter | SE2020 |
| Measured | |
| Wavelength Drift after Vibration (nm) | < +0.1 to < -0.2 |
| FWHM Resolution after Vibration (nm) | < ±0.1 |
| Wavelength Drift after Shock (nm) | < -0.3 |
| FWHM Resolution after Shock (nm) | < ±0.1 |
For a full copy of the report, please send us an